Everything You Need.
Nothing You Don't.
From quick verdict to PhD-level depth — one platform, four workflows.
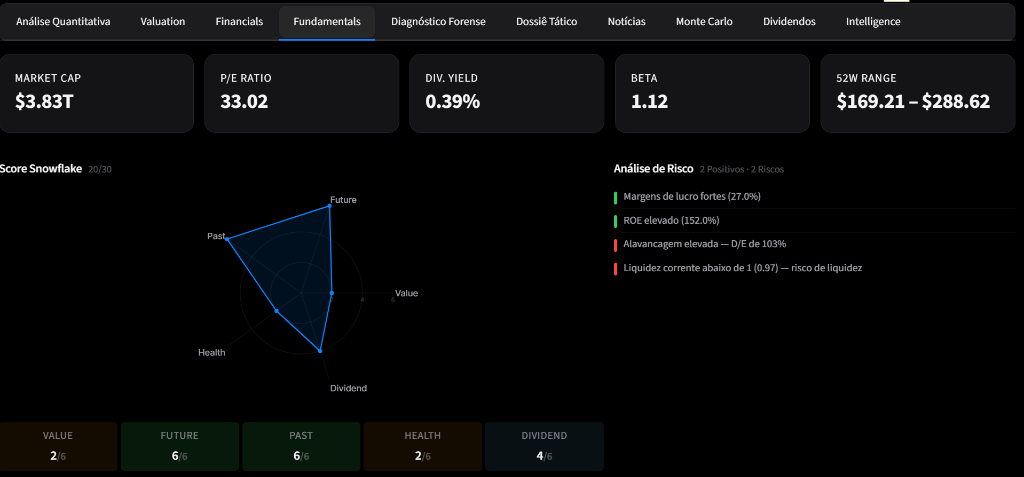
Snowflake Score — 360° X-Ray
Type any ticker and get a complete quantitative score in seconds. Six pillars — Value, Growth, Health, Profitability, Momentum, and Dividend — distilled into a single Snowflake chart that reveals everything at a glance. Plus analyst consensus, target prices, and a clear buy/hold/sell signal.
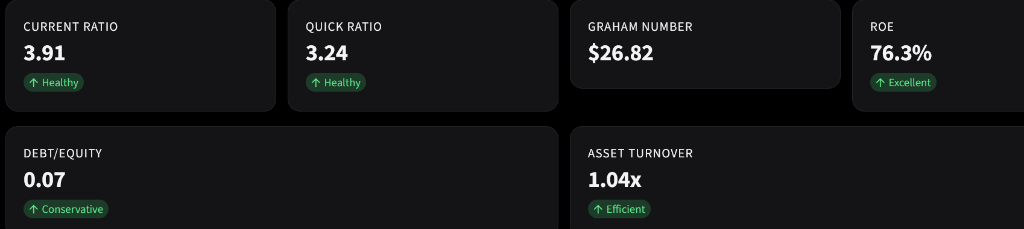
Forensic Analysis
Go beyond the surface. Piotroski F-Score, Altman Z-Score, Beneish M-Score, DuPont decomposition — institutional-grade accounting forensics that reveal whether a "cheap" stock is a bargain or a trap. Automated red/green flags for every metric.
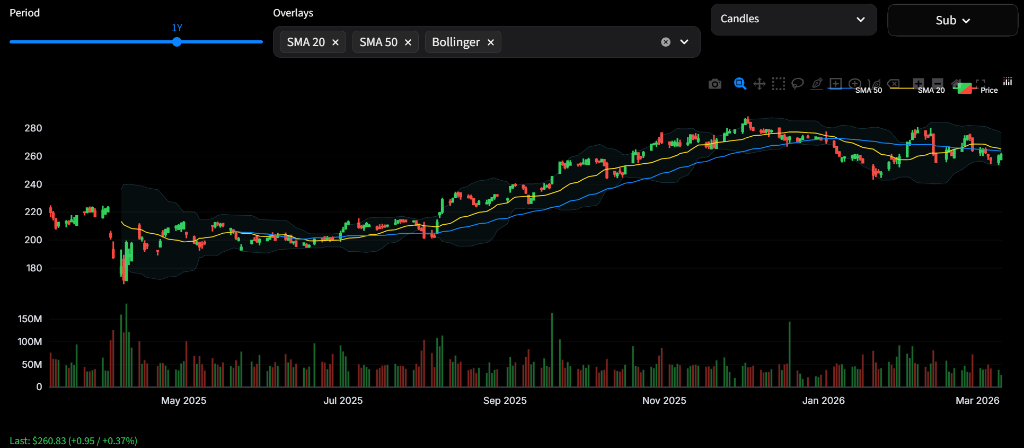
Professional Charts
Interactive technical charts with Bollinger Bands, Volume profile, Support/Resistance levels, and 20+ indicators. Built on Plotly for buttery-smooth panning and zooming.
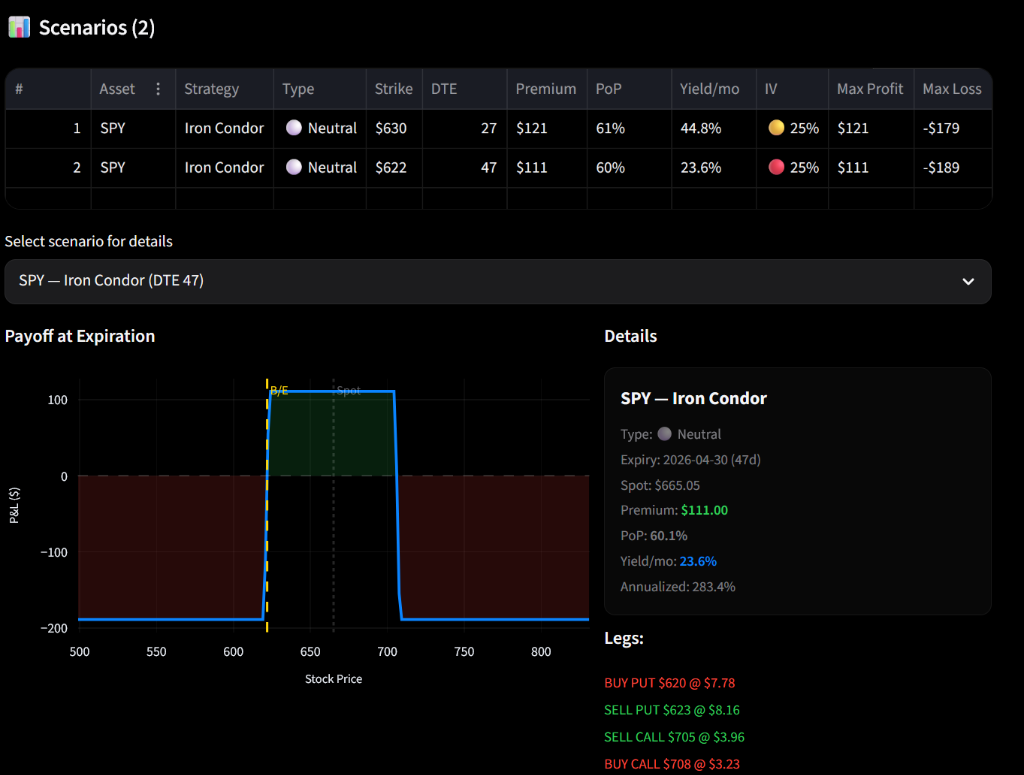
🎮 Options Playground
Compare 19 options strategies side-by-side with real market data. CSP, Covered Call, PMCC, Wheel, Iron Condor, and 14 more — each with payoff diagrams, probability-of-profit, monthly yield, and Greeks. Plus timeline projections showing month-by-month income for cyclical strategies.
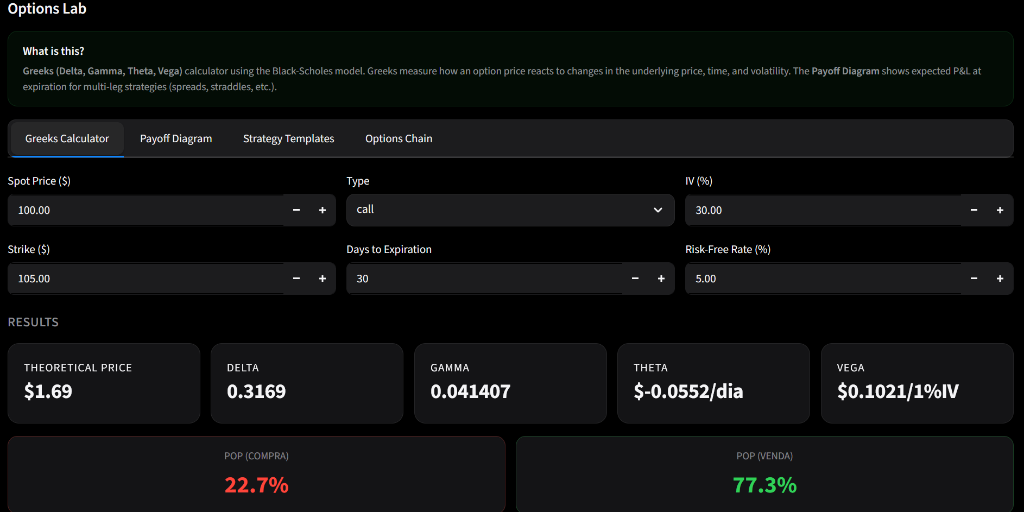
Options Lab — Greeks Calculator
Black-Scholes Greeks for any option: Delta, Gamma, Theta, Vega, Rho. Visualize how your position changes with price, time, and volatility. Essential for understanding options risk before you trade.
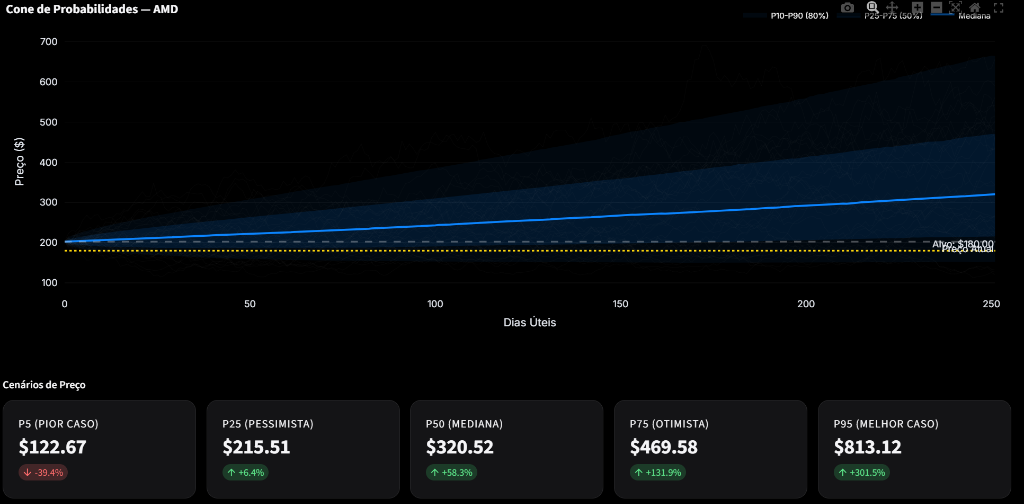
Monte Carlo Simulator
Simulate thousands of future price scenarios using geometric Brownian motion — the same model Wall Street quants use. Visualize probability cones and set realistic targets based on statistical distributions.
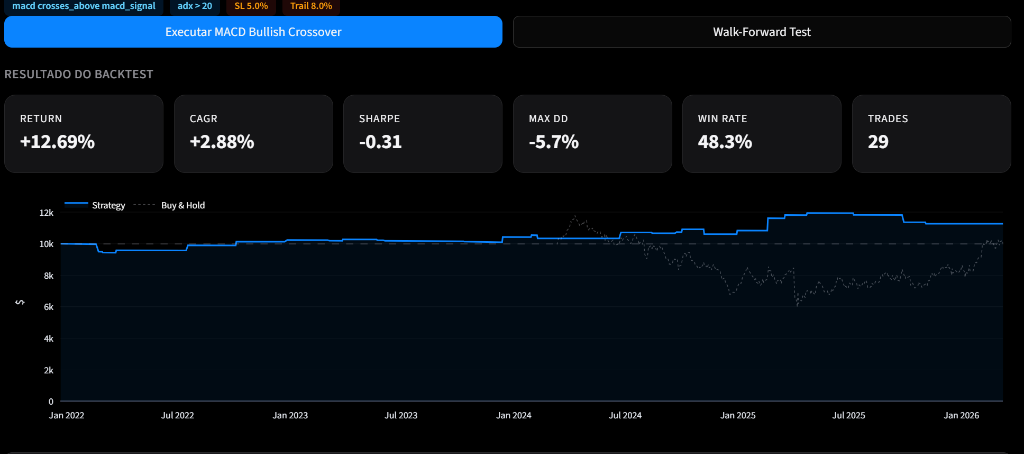
Strategy Backtester
Test strategies with real historical data, realistic slippage and commissions. 8 preset strategies (Golden Cross, RSI Bounce, MACD Cross, and more) or build your own with 20+ indicators. Includes Walk-Forward validation to detect overfitting before you risk real money.
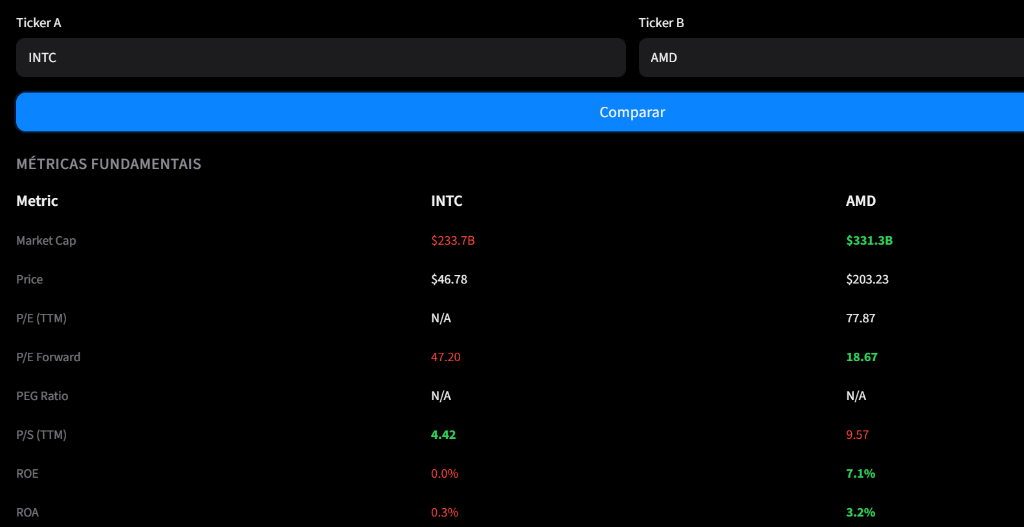
Side-by-Side Comparator
Compare two stocks across fundamentals, technicals, and valuation metrics in a single view. Visual radar charts, normalized price overlays, and clear winner/loser indicators make the choice obvious.
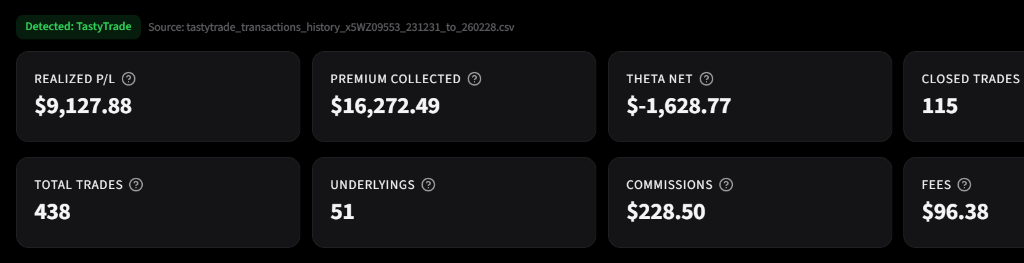
Trade History & KPIs
Import your broker CSV (TastyTrade, IBKR, Schwab, Fidelity) and get instant performance analytics. Win rate, profit factor, equity curve, streak tracking, and capital overview — all calculated automatically.
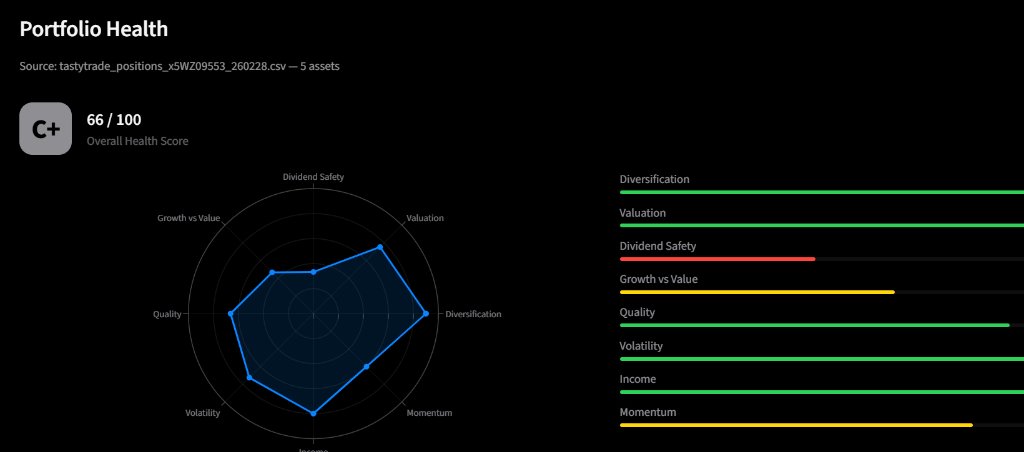
Portfolio Health Audit
Automated portfolio risk analysis with concentration radar, sector breakdown, correlation heatmaps, and actionable recommendations. Know exactly where your risk is hiding.
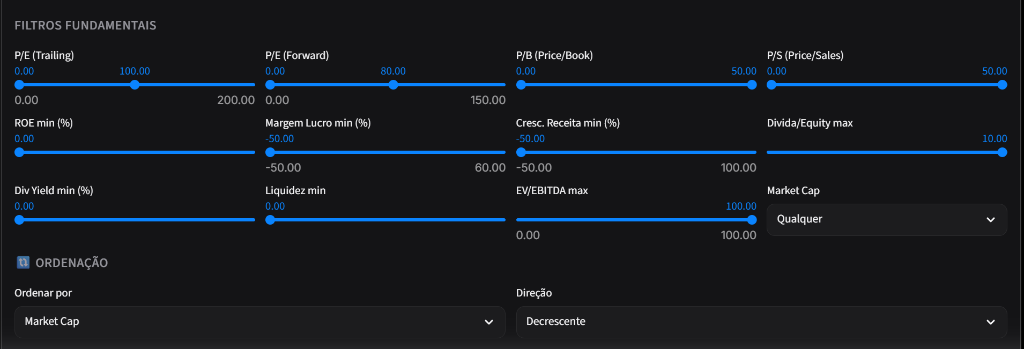
Smart Screener & Sector Radar
Filter the entire US market by fundamentals — P/E, P/B, ROE, margins, debt ratios, dividend yield, and more. Pair it with the Sector Radar to spot rotation signals and find where institutional money is flowing.
Earnings Calendar & Alerts
Never miss an earnings date. See upcoming reports for your watchlist, set price alerts for any ticker, and get notified when targets are hit. Also includes PDF and CSV report exports for any analysis.